Viewing Critical Events (On-Highway Trucks)
Viewing Critical Events (ATA)
 |
| Figure 1.1 - Critical Events |
#Purpose
The Critical Events function provides information on "Special" Logged Events,
including when the Event started (real time), how long it was active, the
extreme value, and the average value. A single Event Codes can be logged
multiple times.
#Accessing
1). To run the Critical Events function, select Events from the Diagnostics
menu, and then select Critical Events from the sub-menu.
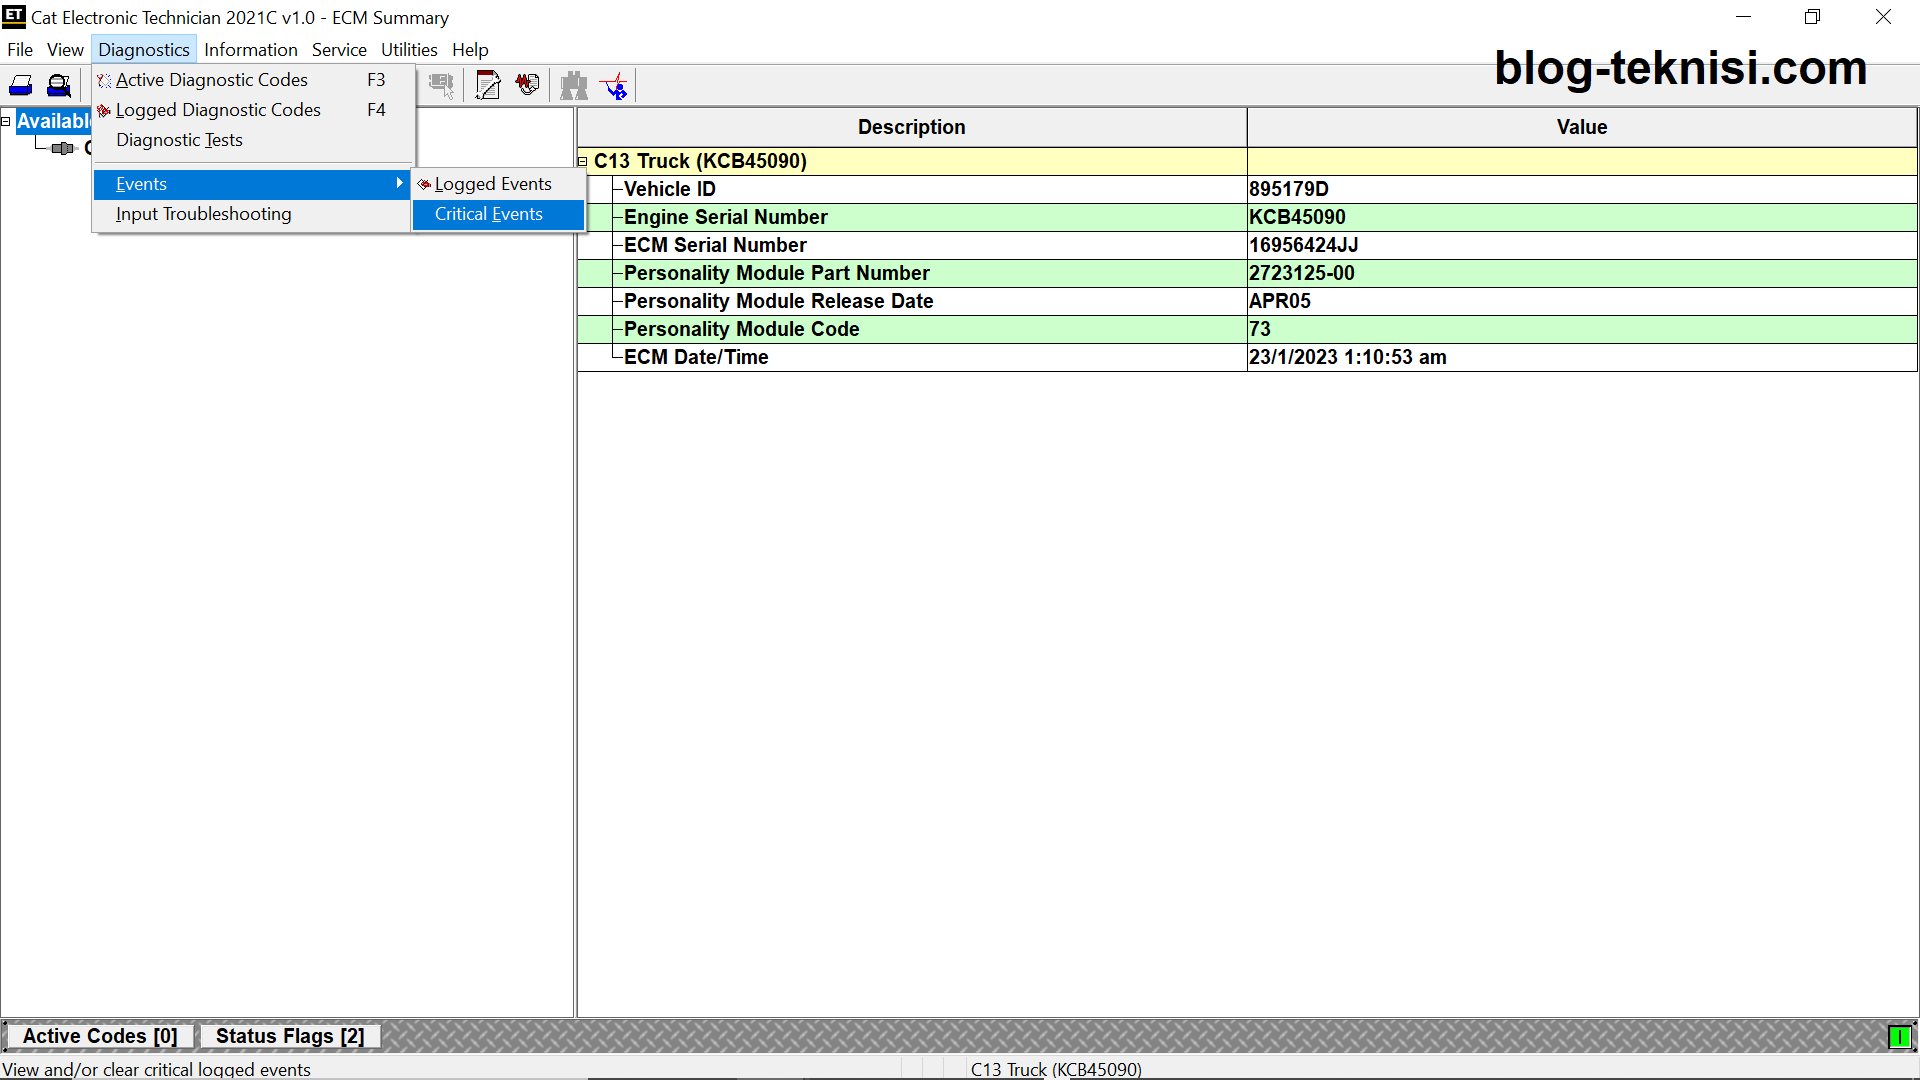 |
| Figure 1.2 - Events (Critical Events) |
2). The Critical Events screen displays (refer to Figure 1.1 above).
#Screen Layout
The Critical Events screen has the following areas:
A). Display Area
The ECM name displays as a category above its list of Event Code(s). The
lists of codes display chronologically by the service hour meter most recently
occurred.
The Critical Events display area has five columns:
- Description – Names the Critical Events.
- Start Time – Displays the date and time that the Event occurred.
- Elapsed – Displays the amount of time that the Event was active.
- Extreme – Displays the Extreme value that the Event reached.
- Average – Displays the average value while the Event was active.
B). Buttons
- Clear – When clicked, this button clears the selected Logged Diagnostic Code.
- Clear All – When clicked, all Logged Diagnostic Codes and all Logged Event Codes are cleared simultaneously. If more than one ECM is available on the data link, all Logged Diagnostic and Event Codes may be cleared on the data link or from the current ECM only.
 |
| Figure 1.3 - Clear |
ReplyDeleteThanks
This is very informative.
vidmate pro apk mod
ccleaner crack
These events often feature limited-edition characters, exclusive storylines, and unique challenges https://petrogalant.com/
ReplyDeleteFire trucks make people feel safe. fire trucks for sale
ReplyDeleteWe have thousands of businesses listed on our breakdown inc software, spanning the United States.repairable trucks
ReplyDeleteWhile they can be a cool throwback to heavy-duty trucks, on a regular pickup, they often look out of place and contribute to excessive exhaust smoke.evolution of Rivian trucks
ReplyDelete