Detroit Diesel Diagnostic Link (DDDL) Software: Diagnostic Instrumentation
Diagnostic Instrumentation
 |
| Figure 1.1 - Diagnostic Instrumentation (List^5) |
The instruments in the Instrumentation Window are grouped together on tabs.
You can choose how they are grouped by choosing Normal Instrumentation or
Diagnostic Instrumentation commands in the Diagnostics menu.
#To open Diagnostic Instrumentation:
1). Connect DETROIT Engine (DDEC) using Detroit Diesel Diagnostic Link (DDDL v6.46). Read More: How to Connecting DETROIT Engine using Detroit Diesel Diagnostic Link (DDDL).
2). Click on Diagnostics menu - Diagnostic Instrumentation.
 |
| Figure 1.2 - Diagnostics (Diagnostic Instrumentation) |
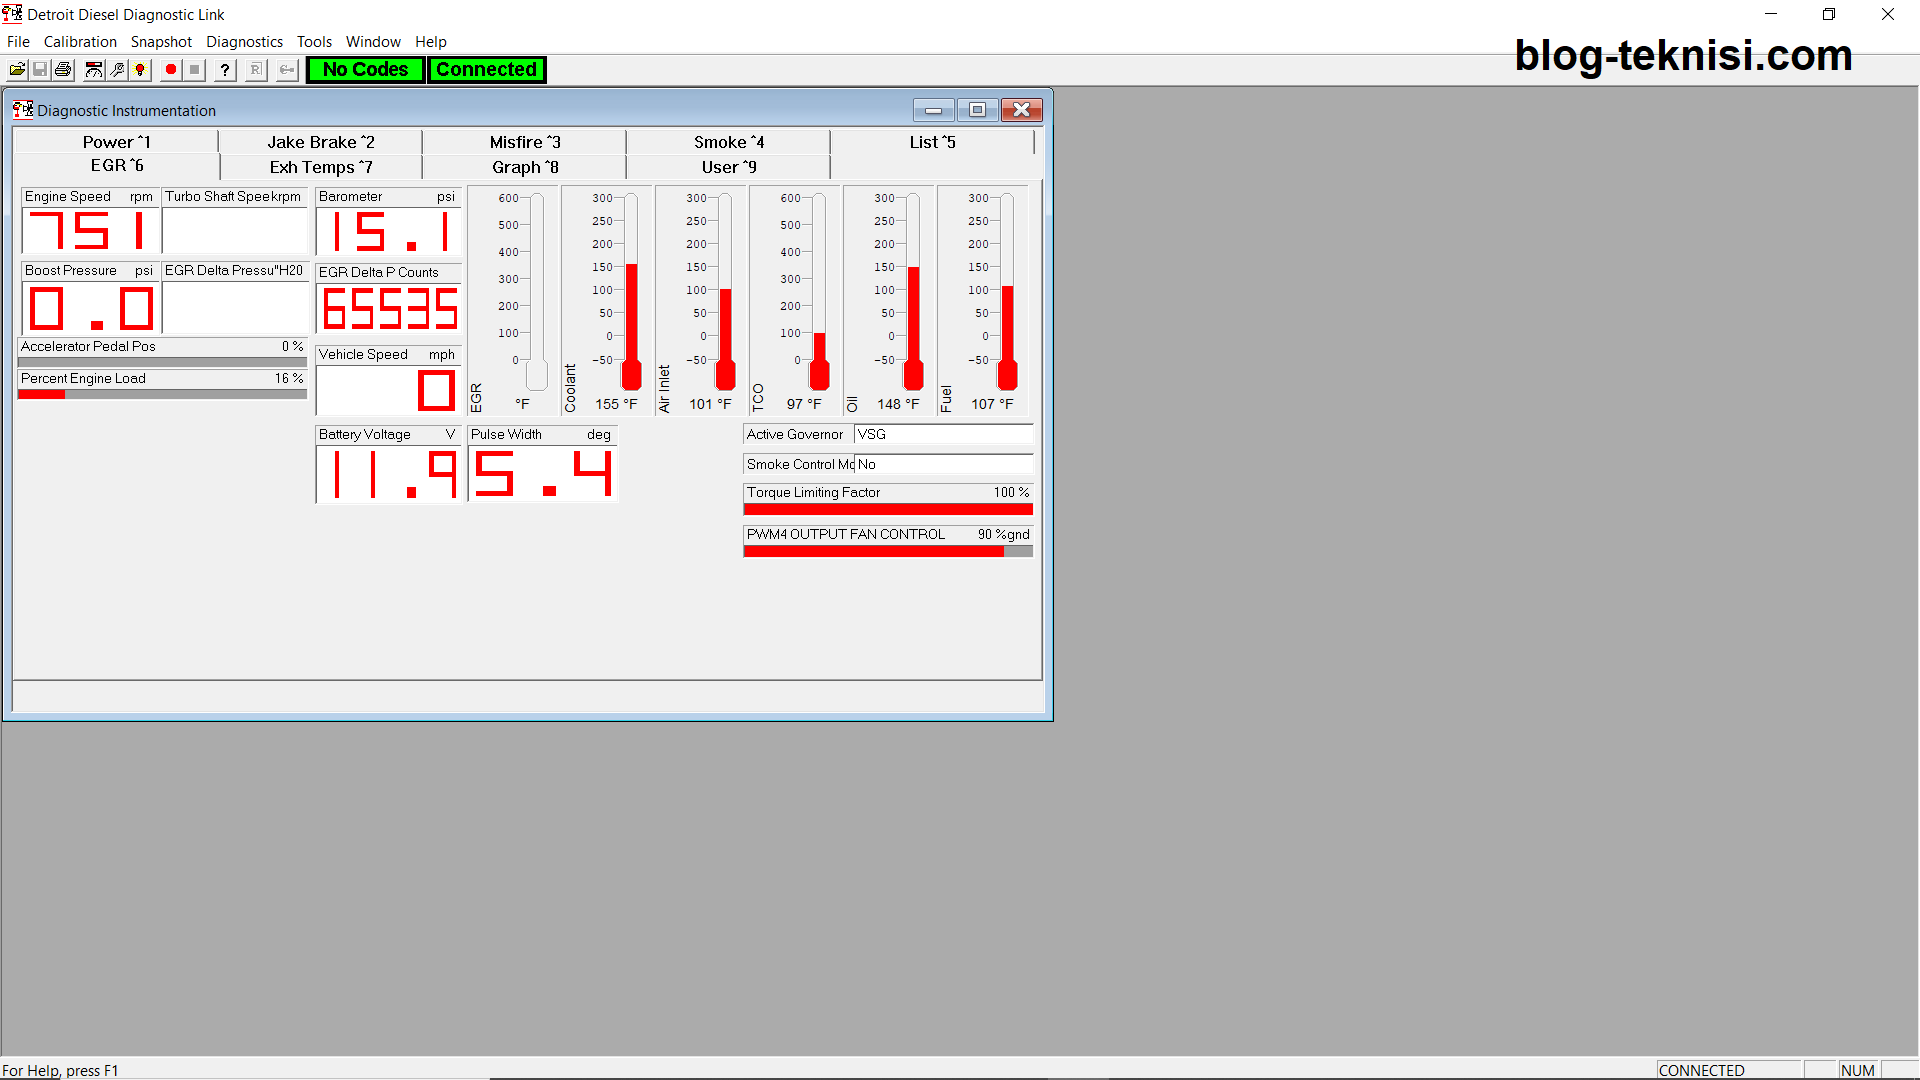
3). A radio button will appear beside the command in the menu when it is selected. The window displays live data measurements from the ECM connected to your PC.
 |
| Figure 1.3 - Diagnostic Instrumentation (Power^1) |
 |
| Figure 1.4 - Diagnostic Instrumentation (Jake Brake^2) |
 |
| Figure 1.5 - Diagnostic Instrumentation (Misfire^3) |
 |
| Figure 1.6 - Diagnostic Instrumentation (Smoke^4) |
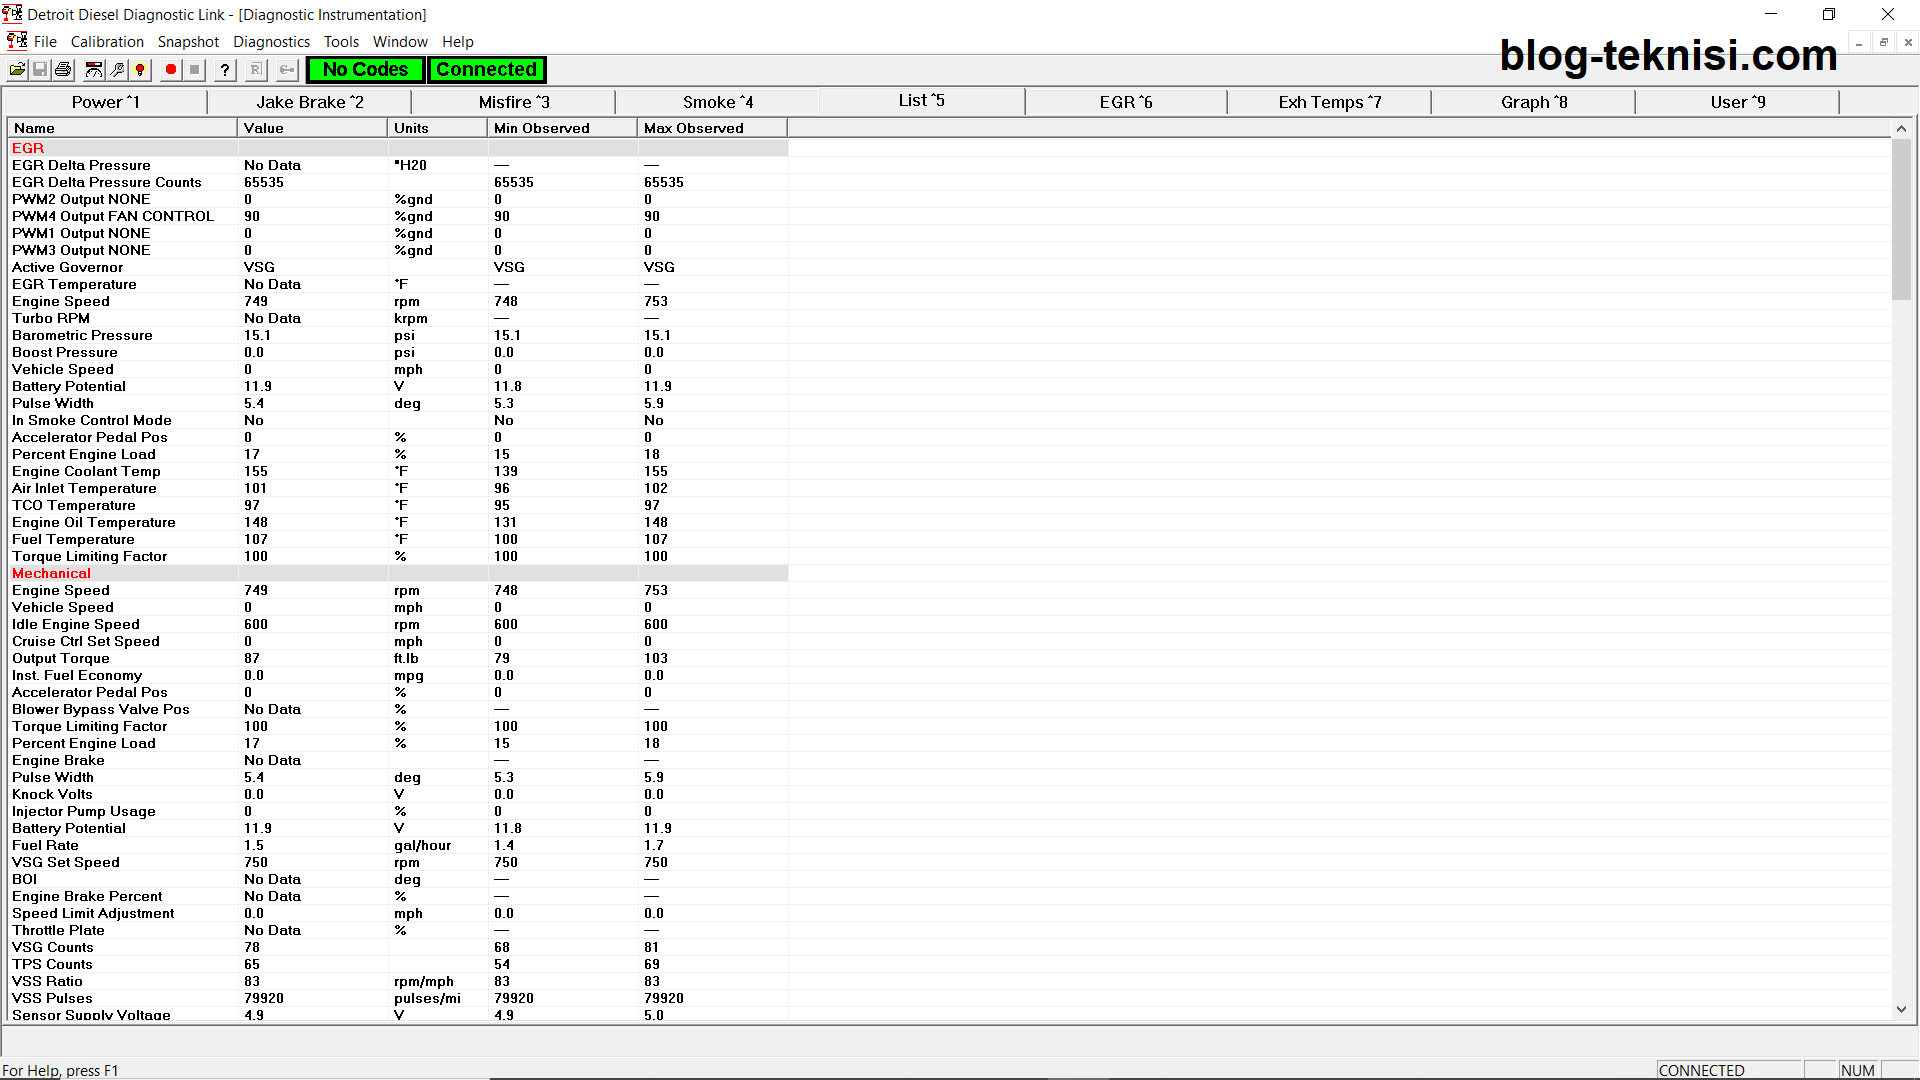 |
| Figure 1.7 - Diagnostic Instrumentation (List^5) |
 |
| Figure 1.8 - Diagnostic Instrumentation (EGR^6) |
4). You can customize the information shown in the Instrumentation window using the Graph or User pages.
(A). Clicking on the Graph tab in the Instrumentation window displays the Graph page:
→The Graph page allows you to display traces showing the variation of selected measurements over time. Read More: Graph Page on Detroit Diesel Diagnostic Link (DDDL) Software. |
| Figure 1.9 - Diagnostic Instrumentation (Graph^8) |
(B). Clicking on the User tab in the Instrumentation window displays the User page:
→The User page allows you to monitor your own selection of measurements by assigning them to appropriate instruments.
→The page provides four meters, one digital meter and three indicators.
→To choose which measurements to monitor:
 |
| Figure 2.1 - Diagnostic Instrumentation (User^9) |
Press Modify to display the Modify user page dialog box:
→For each instrument, choose what measurement you want it to display from the drop-down list box below the instrument.
→When you close the Modify user page dialog box, the current values of the chosen measurements will be shown on the instruments.
#To save the current user page settings in a file:
→Press Save to display standard Windows Save As dialog box:
→Select the folder in which to save the file.
→Enter a File name for the file.
→Press Save to save the file and close the dialog box:
Figure 2.2 - Save User Page Settings As
 |
| Figure 2.2 - Save User Page Settings As |
#To load a set of previously saved graph page settings:
→Press Load to display a standard Windows Open dialog box.
→Use the dialog box to locate the folder holding the required file.
→Click on the File name to select it.
→Press Open to close the dialog box and load the settings.
 |
| Figure 2.3 - Load User Page Settings |
Read More:
Blog.Teknisi
0 Response to "Detroit Diesel Diagnostic Link (DDDL) Software: Diagnostic Instrumentation"
Post a Comment